

Behavioral health analytics software connects clinical, operational, and financial data to support reporting across care delivery and revenue performance. Buyers commonly solve this need with a purpose-built behavioral-health platform, a general BI tool, or an enterprise analytics stack.
This guide gives a 30/60/90 pilot plan, cost guidance, and a simple rule to shortlist 2-3 vendors. If you need help immediately, request a demo to see KPI dashboards in Alleva Intelligence.
TL;DR: If you want behavioral health dashboards without building them, choose a purpose-built platform. If you have data engineers and a governance function, choose a BI tool and budget for the build.
Key Takeaways
- Top pick (pilot): Alleva. Start with a 30-day pilot scoped to one program.
- Demo cadence (timing): Shortlist 2-3 vendors and run comparable demos within 2 weeks.
- Budget expectation (cost): Ask vendors to quote implementation and integration separately from subscription, so you can compare on the same basis.
- Shortlist rule (vendor count): Use sandboxed demos to validate finalists within 30 days.
- Decision rule: If you have no data engineers, choose purpose-built. If you have a data team and a governance function, choose BI and budget for the build.
What is behavioral health analytics software?
Behavioral health analytics software is a purpose-built system that collects and analyzes behavioral-health clinical, operational, and financial data to surface reporting and support audit-ready documentation. It differs from generic healthcare analytics by prioritizing behavioral-health measures, level-of-care logic, and templates for accreditation reporting.
Who is it best for? Providers include addiction treatment centers, outpatient mental health clinics, and multi-site recovery programs. Primary users are operations and clinical leaders, revenue teams, and compliance staff.
What it replaces or consolidates: it replaces ad-hoc EHR/EMR (electronic medical record / electronic health record) exports and separate RCM (revenue cycle management) and CRM (customer relationship management) dashboards with unified views across referral, care, and billing.
Core jobs this software performs
- Measurement-based care / PRO tracking (PRO = patient-reported outcomes, standardized questionnaires completed by patients about symptoms, functioning, or quality of life): ingest and trend PHQ-9/GAD-7 (PHQ-9 = Patient Health Questionnaire-9, a 9-item depression screening and severity tool; GAD-7 = Generalized Anxiety Disorder-7, a 7-item anxiety screening and severity tool) scores for clinical decision-making.
- Cohort and outcomes analysis: compare groups by diagnosis, program, or pathway.
- RCM analytics: surface denial drivers and days in A/R (A/R = accounts receivable) tied to clinical documentation.
- Referral-to-start visibility: measure time and drop-off from referral to first appointment.
- Accreditation and compliance reporting: generate CARF (CARF = Commission on Accreditation of Rehabilitation Facilities) and Joint Commission-ready exports with audit trails.
- Role-based dashboards: deliver clinician, admissions, finance, and leadership views.
For product-level detail, see Alleva Intelligence.
Best behavioral health analytics software in 2026
| Product | Best for | Starting price | Deployment / model |
|---|---|---|---|
| Alleva | Multi-site behavioral health operations | Custom quote | Cloud SaaS, modular |
| Netsmart | Large health systems | Custom quote | Cloud SaaS / enterprise |
| Qualifacts | Community behavioral health agencies | Custom quote | Cloud SaaS |
| Health Catalyst | Enterprise health systems | Custom quote | Enterprise analytics platform |
| Tableau | Custom visualization teams | Custom quote | BI / visualization platform |
| Microsoft Power BI | Microsoft-stack organizations | Custom quote | BI platform (cloud/embedded) |
| SAS Analytics | Advanced predictive-modeling teams | Custom quote | Analytics suite / enterprise |
Buyer-type mapping
- Small practice: favor lower setup overhead and a shorter path to a first dashboard.
- Multi-site group: prioritize connected EMR plus analytics and admissions-to-billing visibility (consider Alleva).
- Large health system / enterprise: prioritize integrations, governance, and payer reporting.
Quick pick-by-profile rule: if you need a single platform covering admissions, documentation, billing, and analytics, choose Alleva; if you need deep custom visuals and have engineering resources, choose a BI platform like Tableau or Power BI.
1. ALLEVA: Best for connected behavioral health operations
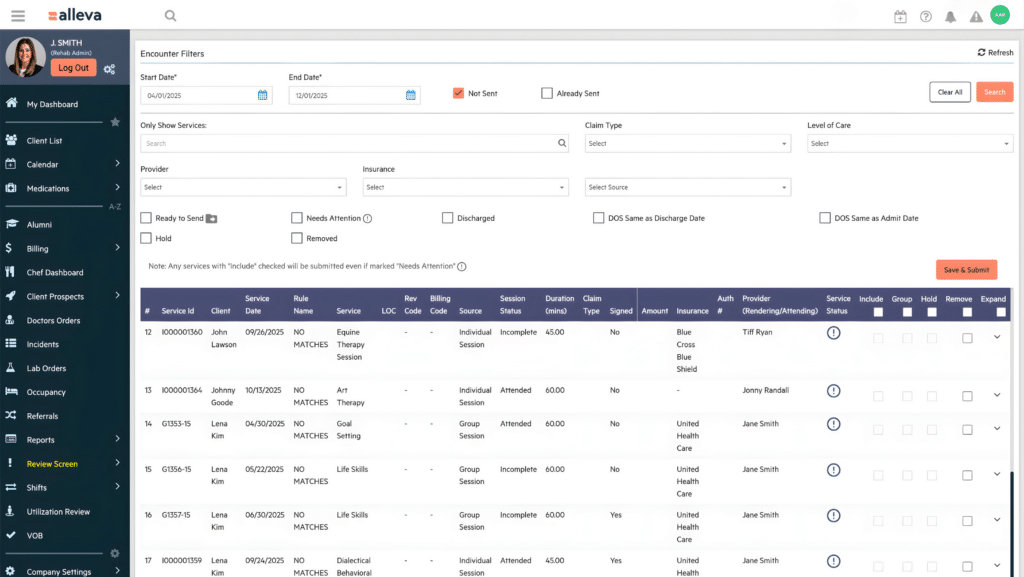
Alleva is an all-in-one operations platform built exclusively for behavioral health. It links analytics to EMR, CRM, and RCM so dashboards connect directly to operational workflows and tasks.
Alleva Intelligence supplies dashboards across Insights, Echo, and Travis. The platform emphasizes audit-readiness and operational tasking so reporting connects back to the record that produced it.
Pricing: Custom quote
Key Features:
- Clinician KPI dashboards tied to the underlying documentation.
- Custom dashboards designed for multi-location visibility.
- A connected, real-time view of operations across programs.
- MBR and QBR-ready reports for executive teams.
- Audit-ready documentation for utilization review and accreditation.
- A clinical compliance dashboard for oversight and reporting.
Pros:
- Operations: centralized KPIs and task linkages reduce manual reporting.
- Clinical: reporting connected to the chart rather than a nightly export.
- RCM: denial and claims reporting handled in behavioral health billing and RCM, in the same system.
- Compliance: accreditation tracking against CARF, Joint Commission, and state requirements sits in InCheck.
- Growth: admissions and referral activity live alongside clinical and billing data.
Cons:
- Implementation requires coordination across EMR, CRM, and billing teams.
- Full value depends on running Alleva as the system of record, not only as a reporting layer.
See the full review workflow live, from unsigned note to submitted claim:
2. Netsmart: Best for integrated behavioral-health EHR customers
Netsmart provides EHR plus embedded analytics for community behavioral-health providers. It preserves event-level continuity between charting and analytics, which speeds regulatory and clinical reporting for organizations already on Netsmart EHR.
Pricing: Custom quote
Key Features:
- Clinical and operational dashboards tailored to behavioral health.
- Prebuilt templates for regulatory measures and state reporting.
- Population-health tools and risk stratification.
- Event-level drill-downs and cohort builders.
- Scheduled reporting and operational financial analytics.
Pros:
- Deep native EHR continuity for clinical reports.
- Prebuilt behavioral-health templates reduce build time.
- Population-health tied to clinical events.
Cons:
- Complex configuration for nonstandard workflows.
- Less visual flexibility out of the box versus modern BI without customization.
- Pricing and module bundling often require negotiation.
3. Qualifacts: Best for community mental health centers and public behavioral health
Qualifacts focuses on community mental health centers and county/state behavioral-health workflows. It ships state-focused templates and population reporting designed for government reporting and Medicaid workflows.
Pricing: Custom quote
Key Features:
- Care coordination dashboards for cross-team workflows.
- State-reporting templates and compliance-ready exports.
- PRO ingestion and aggregated population dashboards.
- Role-based operational reports for programs and managers.
Pros:
- Fast implementation for state and county reporting workflows.
- Strong templates for Medicaid and county reporting.
- Usable dashboards for program monitoring.
Cons:
- Less emphasis on advanced predictive modeling or custom ML.
- Fewer prebuilt integrations for very large enterprise ecosystems.
- Contract terms and pricing usually require negotiation.
4. Health Catalyst: Best for enterprise health systems with advanced analytics teams
Health Catalyst is an enterprise analytics platform geared to large health systems with centralized analytics teams. It provides curated clinical data models, an enterprise data warehouse, and embedded predictive analytics to support governance at scale.
Pricing: Custom quote
Key Features:
- Enterprise data warehouse (EDW) and curated clinical models.
- Predictive analytics and model operationalization.
- Care-quality measurement and enterprise reporting.
- Interoperability connectors and governance tooling.
Pros:
- Strong clinical logic and consistent measurement across large systems.
- Enterprise-grade governance and scalability.
- Built for teams that need validated, auditable models.
Cons:
- Requires significant data engineering and governance effort.
- Longer implementation times and higher total cost of ownership.
5. Tableau: Best for custom visualization teams with strong data engineering
Tableau is a visualization-first BI platform for teams that need bespoke dashboards and embedding. It offers rich visual analytics but requires ETL and data modeling to produce reliable clinical measures.
Pricing: Custom quote
Key Features:
- Advanced visual analytics and drag-and-drop exploration.
- Self-service dashboards and embeddable visuals.
- Large connector library and extension ecosystem.
- Calculated fields and advanced analytic functions.
Pros:
- Deep visual flexibility and embedding options.
- Scales for complex reporting and custom UX.
- Large community and marketplace for extensions.
Cons:
- Requires substantial ETL and data modeling for clinical reliability.
- No behavioral-health-specific templates without customization.
- Ongoing build and maintenance can be costly.
6. Microsoft Power BI: Best for organizations using the Microsoft stack
Power BI suits Microsoft-centric IT shops that value low-cost entry and Office/Azure integration. It can visualize behavioral-health data well but requires building clinical models and privacy controls.
Pricing: Custom quote
Key Features:
- Embedded analytics, paginated reports, and custom visuals.
- Active Directory and Azure connector integration.
- Power Query ETL and DAX for calculated metrics.
- Options for embedded or Premium licensing.
Pros:
- Familiar Microsoft ecosystem, lower entry costs.
- Strong visualization and embedding support.
- Good for orgs already standardized on Azure/Office 365.
Cons:
- Behavioral-health templates and consent handling require engineering.
- Governance and clinical-modeling responsibilities fall to the buyer.
7. SAS Analytics: Best for statistical and predictive-modelling teams
SAS is suited to organizations that need validated, auditable statistical models and model governance for research or regulated reporting. It supports advanced model development, validation, and model-life-cycle controls.
Pricing: Custom quote
Key Features:
- Advanced statistical procedures and validated models.
- Model governance, version control, and audit trails.
- Risk stratification and cohort scoring at scale.
- Integration points for operationalizing predictions.
Pros:
- Powerful for complex, validated models requiring auditability.
- Strong traceability and model governance controls.
Cons:
- Requires experienced analytics staff and integration effort.
- Longer time to operationalize predictions for front-line teams.
How We Evaluated behavioral health analytics software
Research completed September 2026 from publicly available vendor documentation, published product materials, and vendor case studies. Disclosure: Alleva is the publisher of this guide and appears in the list, so weigh the Alleva entry accordingly and validate every vendor against your own requirements.
Evaluation criteria and weights
| Criterion | Weight |
|---|---|
| Behavioral-health-specific workflows | 30% |
| Interoperability and integrations (FHIR/HL7/APIs) (FHIR = Fast Healthcare Interoperability Resources; HL7 = Health Level 7, standards for exchanging healthcare data) | 20% |
| RCM and billing analytics | 15% |
| Compliance and audit reporting (CARF / Joint Commission readiness) | 15% |
| Usability / clinician adoption | 10% |
| Security and certifications (HIPAA, SOC 2) | 10% |
We ran a pre-flight screen to remove vendors outside behavioral health and verified vendor facts against published vendor materials.
What to Look For in behavioral health analytics software
Focus on capabilities that separate practical, operational systems from basic dashboards. Ask vendors to demonstrate each capability with your data or a sandbox.
- Data integration: unified ingestion across EMR/EHR, scheduling, RCM, CRM, and third-party feeds. Question: how do you ingest, normalize, and refresh behavioral-health data?
- Specialty dashboards: role-specific views for clinicians, admissions, finance, and compliance. Question: can dashboards be customized per role and exported?
- Cohort and outcomes analysis: build and maintain cohorts for SUD (SUD = substance use disorder), PHQ-9 responders, and program evaluation. Question: are cohort exports pushable to outreach workflows?
- PROs integration: native PHQ-9/GAD-7 ingestion and clinician trendlines. Question: can you ingest scores and show trendlines inside clinician workflow?
- RCM linkage: claims-to-encounter linking and denial-driver dashboards. Question: do dashboards drill to the claim, encounter note, and appeal tasks?
- Privacy and consent: 42 CFR Part 2 handling and access logging. Question: how do you record and honor consent, and how is access logged?
Link examples for evaluation: see behavioral health billing and RCM for claims-to-encounter workflows and the EHR integration guide for mapping.
Clinical outcomes and PROs integration
PRO integration ingests PHQ-9 and GAD-7 scores into the record, renders clinician-facing trendlines, and supports cohort reports. Measurement-based care requires timestamped raw scores and computed change values.
Vendor question: “Can you ingest PHQ-9/GAD-7, show clinician trendlines, and export cohort-level KPI files (patient ID, assessment date, baseline, current score, change)?”
KPI example: depression response rate requires patient ID, baseline score, current score, and computed percentage change, visualized as a time-series trend with a cohort filter.
RCM and financial dashboards
RCM dashboards must link clinical events to claims and surface denial drivers, days in A/R, net collection rate, and authorization tracking. These make denial root causes actionable.
Vendor question: “Can I click from a denial to the claim, view the encounter note, codes, and authorization status in one flow?”
Quick wins: run denial scrubs, add auth alerts, and prioritize high-dollar payers for targeted fixes.
KPI templates and cohort analysis
Prebuilt KPI templates (SUD cohorts, PHQ-9 responders) save time. Verify vendors provide template libraries, exportable cohort lists, and API pushes to outreach workflows.
Vendor question: “Do you include behavioral-health cohort templates and a sandbox to validate templates before go-live?”
Example mapping: KPI = no-show rate, required fields = appointment date, status, patient ID, visualized as a funnel or heatmap.
Integration and interoperability
Map EHR/EMR, scheduling, RCM, CRM, and telehealth. Choose transfer methods (FHIR, HL7, API/ETL) and standardize behavioral-health fields (PROs, level-of-care).
Vendor question: “Which endpoints and refresh cadence are supported, and what pre-built connectors exist?”
Role-based dashboards and clinician workflow
Leadership roll-ups differ from clinician views. Embedded analytics increase adoption when they appear inside the clinician workflow.
Vendor question: “Can you provide clinician test accounts to demonstrate embedded analytics and role-based alerts?”
Example KPIs: CFO sees net revenue and A/R days; clinical director sees no-show rate and treatment-plan completion; clinician sees daily caseload and next tasks.
Data quality and governance
Build a canonical data model, a master patient index, automated validation checks, and lineage monitoring. Preserve consent records and Part 2 status.
Vendor question: “What automated data-quality checks and lineage views are available, and how do you surface failures?”
Compliance and audit reporting
Require CARF and Joint Commission templates, documentation-completeness dashboards, and immutable audit logs. Request sample exports and retention-policy documents.
Vendor question: “Can you export accreditation reports and audit logs in machine-readable (CSV/JSON) and printable formats, and demonstrate retention policies?” See the compliance hub for example templates.
How much does behavioral health analytics software cost?
Costs vary by license, implementation, and data work. Use quote-based pricing as the baseline and budget for implementation, integrations, training, and ongoing governance.
| Cost Component | Typical Range | Notes |
|---|---|---|
| Subscription / license | Custom quote | Quoted per facility, per seat, or per module |
| Implementation and setup | Custom quote | Project management, config, go-live support |
| Data migration / ETL | Custom quote | Varies by source complexity and data quality |
| Integrations / connectors | Custom quote | API work, interface engines, connector licenses |
| Training and change management | Custom quote | On-site or virtual training and super-user support |
| Hosting / maintenance | Custom quote | SaaS hosting, backups, security monitoring |
Buyers commonly underestimate ongoing governance, clinician time for adoption, and connector maintenance. If billing analytics are in scope, an integrated platform reduces reconciliation overhead by removing one of those connector lines entirely.
How to Implement behavioral health analytics software
A staged 30/60/90 pilot reduces risk and shows value quickly. Assign a steering team and validate mapping, consent handling, and KPIs before cutover.
Pilot (Days 0-30)
- Scope: one site or program with 10-20 clinicians and representative payers.
- Roles: CIO (infrastructure), CMIO (clinical validation), RCM lead, site clinical champion.
- Deliverables: mapped extracts, one operational dashboard, training, and an acceptance test plan.
- Set your own baseline first, then agree adoption and data-freshness targets with the vendor in writing.
Expand integrations and validation (Days 31-60)
- Add full EHR, scheduling, and billing feeds; finalize ETL and reconciliation tests.
- Deliverables: end-to-end pipeline, UAT (user acceptance testing) signoffs, and an SLA (service level agreement) for data latency.
- Measure against the baseline you set in the pilot, not against a vendor benchmark.
Operationalize and cutover (Days 61-90)
- Finalize runbooks, monitoring, and alerting; train remaining users and transition reporting ownership.
- Deliverables: cutover and rollback plans, monitored first 30 days, optimization backlog.
- Confirm the pilot KPIs held once full volume moved through the pipeline.
Common derailers and mitigations
- Poor data mapping. Run an early mapping workshop and automated reconciliation tests.
- Unclear 42 CFR Part 2 consent handling. Involve legal and compliance, record consent status, and test the flows before go-live.
- Lack of executive sponsorship. Form a steering committee and put one page in front of it tying the work to revenue and clinician time.
Before cutover, verify pilot KPIs, data reconciliation, consent handling, and rollback plans. For deeper technical checklists, see the EMR migration guide.
How 2024-2026 privacy and interoperability rules affect behavioral health analytics
Two regulatory changes reshaped how behavioral health organizations handle analytics data, and one of them is widely described backwards.
The 42 CFR Part 2 final rule reached its compliance date on February 16, 2026. It now permits a single patient consent covering all future uses and disclosures for treatment, payment, and health care operations.
The rule also states plainly that a program receiving records under that single consent is not required to segregate or segment those records (§ 2.12(d)(2)(i)(C)). Segmentation may still suit your risk posture, but it is now a choice rather than a requirement.
Two things did get stricter. SUD counseling notes became a distinct category needing their own specific consent, so they cannot ride on a broad treatment, payment, and operations authorization. Enforcement also moved to civil and criminal penalties mirroring HIPAA.
On interoperability, ASTP/ONC certification still runs on USCDI v3 as the baseline, with v6 published in July 2025 and newer versions phasing in through the Standards Version Advancement Process.
Practical actions
- Capture consent at intake using machine-readable templates (for example, FHIR Consent).
- Confirm how a vendor records and honors a single consent covering treatment, payment, and operations.
- Ask specifically how SUD counseling notes are handled, since those still require separate consent.
- Preserve audit trails and ensure role-based approvals are logged for overrides.
- Ask vendors which USCDI version they support today, not which they plan to support.
Purpose-built behavioral health analytics vs. general BI platforms: which is right for your program?
Decision framework
- Solo clinician or small group: choose purpose-built for faster value and lower ops overhead.
- Multi-site network: lean purpose-built for consistent reporting and compliance; consider hybrid as you scale.
- Enterprise system: choose generic BI or enterprise analytics if you have strong data engineering, governance, and custom-model needs.
Trade-offs
- Time-to-pilot: purpose-built often gives days to weeks; BI takes weeks to months for clinical parity.
- Customization: BI provides full flexibility but requires data models and governance.
- Regulatory handling: purpose-built platforms ship with behavioral-health privacy patterns; BI requires custom architecture.
- Resource needs: BI requires dedicated data engineering and ongoing maintenance; purpose-built reduces internal ops burden.
FAQs About behavioral health analytics software
How much does behavioral health analytics software cost?
Costs vary by vendor and scope; expect quote-based licensing plus implementation, ETL, integrations, training, and hosting. See “How much does it cost” above for the full cost picture.
What KPIs should I track?
Track clinical, operational, and financial KPIs: no-show and retention rates, PHQ-9/GAD-7 trendlines, length of stay, claims denial rate, and days in A/R. See the “What to Look For” section for KPI-to-dashboard examples.
How does 42 CFR Part 2 affect analytics?
Part 2 protects substance use disorder treatment records. Since the February 16, 2026 compliance date, a single patient consent can cover future treatment, payment, and health care operations, and segmenting Part 2 records is not required under that consent. SUD counseling notes still need their own specific consent.
Will analytics integrate with our EHR?
Most platforms integrate but require planning. Confirm vendor support for your EHR’s exports, FHIR/HL7 support, field mapping, and refresh cadence during a demo.
How soon will we see ROI?
It depends on which problem you point it at. The fastest wins usually come from automating reports your team builds by hand and fixing repeat denial reasons, so set a baseline for both before go-live and measure against it.
What should I ask for in a demo?
Request role-based walkthroughs and sandbox access, sample KPI reports, field-mapping examples, data refresh cadence, and a migration plan. Ask every vendor the same scenario so you can compare like for like.
Which one should you shortlist
Alleva because it links EMR, CRM, and RCM so reporting traces back to the record that produced it across multi-site programs.
Netsmart, for organizations already on Netsmart EHR that need native EHR continuity.
Budget option: Power BI or Tableau, for teams with strong data engineering needing custom visuals.
The organizations that choose well do not start by comparing seven platforms. They start by writing down the three reporting questions their team cannot answer today, then make every vendor answer those three with real data.
If your list includes a denial you cannot trace back to a note, a documentation gap you find only at survey, or a census number that three people calculate three ways, those are exactly the questions a connected system should close in one click rather than one quarter.
Bring your three questions. We will show you where each one lands in Alleva, what the underlying data has to look like, and what a 30-day pilot would prove before you commit to anything. No slideware, no scripted tour.
Bring your hardest reporting question, and we will walk you through them!
This guide is for informational purposes and is not legal, compliance, or reimbursement advice. Confirm regulatory requirements with your own counsel or compliance officer.

Bella Maldonado is a Product Manager at Alleva focused on artificial intelligence, business intelligence, and workflow innovation for behavioral health organizations. With a background spanning sales, engineering, and product management, she helps guide the development of AI-powered solutions that reduce administrative burden and improve operational efficiency. Bella is passionate about building technology that empowers healthcare teams and drives meaningful outcomes for providers and patients alike.